
UNDERSTANDING SUSTAINABLE SHIPPING.
We believe better understanding leads to better outcomes. Deeper knowledge of
how the global supply chain significantly contributes greenhouse gasses can result in
routing options that best minimize carbon load factor – and costs – simultaneously.
Mode selection.
The selection of transport modes plays a critical role in determining emission levels for international shipments. Different combinations of transport modes for a trip from the same origin to the same destination can yield substantially different emission levels.
Inland Mode Selection
While many countries are constrained in their ability to provide efficient inland transportation to and from port areas via rail, it is a much more carbon-efficient mode of transport and usually is much more cost-effective. Countries developing their inland rail networks, particularly their intermodal stacked container rail services, will greatly reduce their levels of emissions. Modern intermodal transfer facilities which interchange ocean containers to and from rail movement enable rail alternatives that can have equal transit times with much lower fuel consumption. Intermodal rail has the added benefit of reducing road congestion.
INTERCONTINENTAL MODE SELECTION
For long-distance voyages, the faster transit times of air shipments come at a price of greatly increased emission levels. Air shipments can generate emissions approximately five times higher than those generated by an ocean voyage for the same set of cargo. Aircraft emissions also have a greater effect due to their occurrence at high altitudes, where they can trigger a set of chemical reactions that magnifies their impact. The IPCC has estimated that the climate impact of air transport is two to four times greater than the effect generated by the carbon dioxide emissions alone.
Routing and Route Selection.
For all modes of travel, emission levels are strongly dependent on the distance traveled by the transport vehicle. LOG-NET’s Carbon Calculator models these distances in various ways, depending on the mode of transport.
Vessel Size.
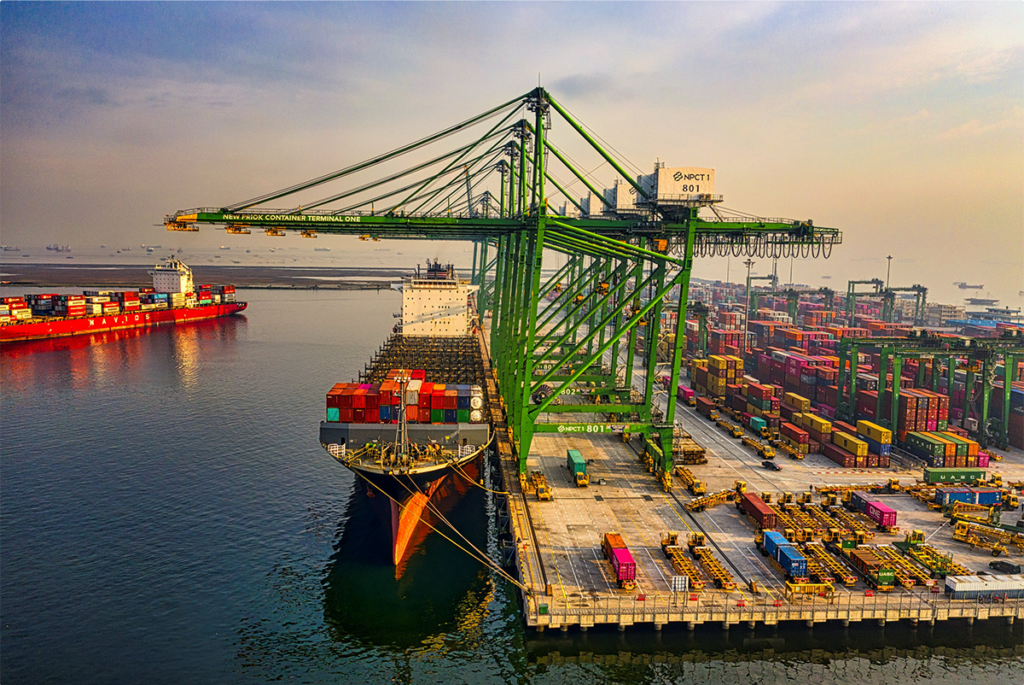
Vessel classes can be categorized in terms of their evolution over the past 10 to 15 years. Older vessels capable of carrying 6,000 TEU are being replaced by vessels able to carry 8,000 or 10,000 TEU. Most of these ships have engines of 40,000 to 60,000 horsepower. As a result the work that the engine performs has been able to move more and more containers per unit of fuel burned, and subsequently, carbon dioxide emitted. Many very large vessels cannot transit the Panama Canal. These vessels exceed the width of the canal. Work is active today to expand the capacity of the canal.
Arrivals and Departures.
Arrivals and departures can be one of the most carbon-costly portions of a journey in any mode of transport. Vessels maneuver in and out of port, flights burn more fuel taking off and landing, and rail engines burn more fuel per unit as they maneuver to efficient operating speeds on their primary routes. LOG-NET’s Carbon Calculator models these effects, and their impact on emission levels. The effect of arrivals and departures is particularly evident for air transport, where fuel consumption during takeoff and climb to cruising altitude can be up to ten times greater than that consumed during level flight. As a result, short-distance air journeys result in a significantly higher level of emissions per unit distance, as compared to longer journeys.
Type of Fuel.
LOG-NET’s Carbon Calculator uses a model that considers that different types of fuel used by the engines in various forms of transport vehicles. Jet fuel, light diesel and heavy diesel are each composed of hydrocarbon molecules with different numbers of carbon atoms. Each fuel will thus generate a different volume of CO2 for each ton of fuel burned.
Dwell Time.
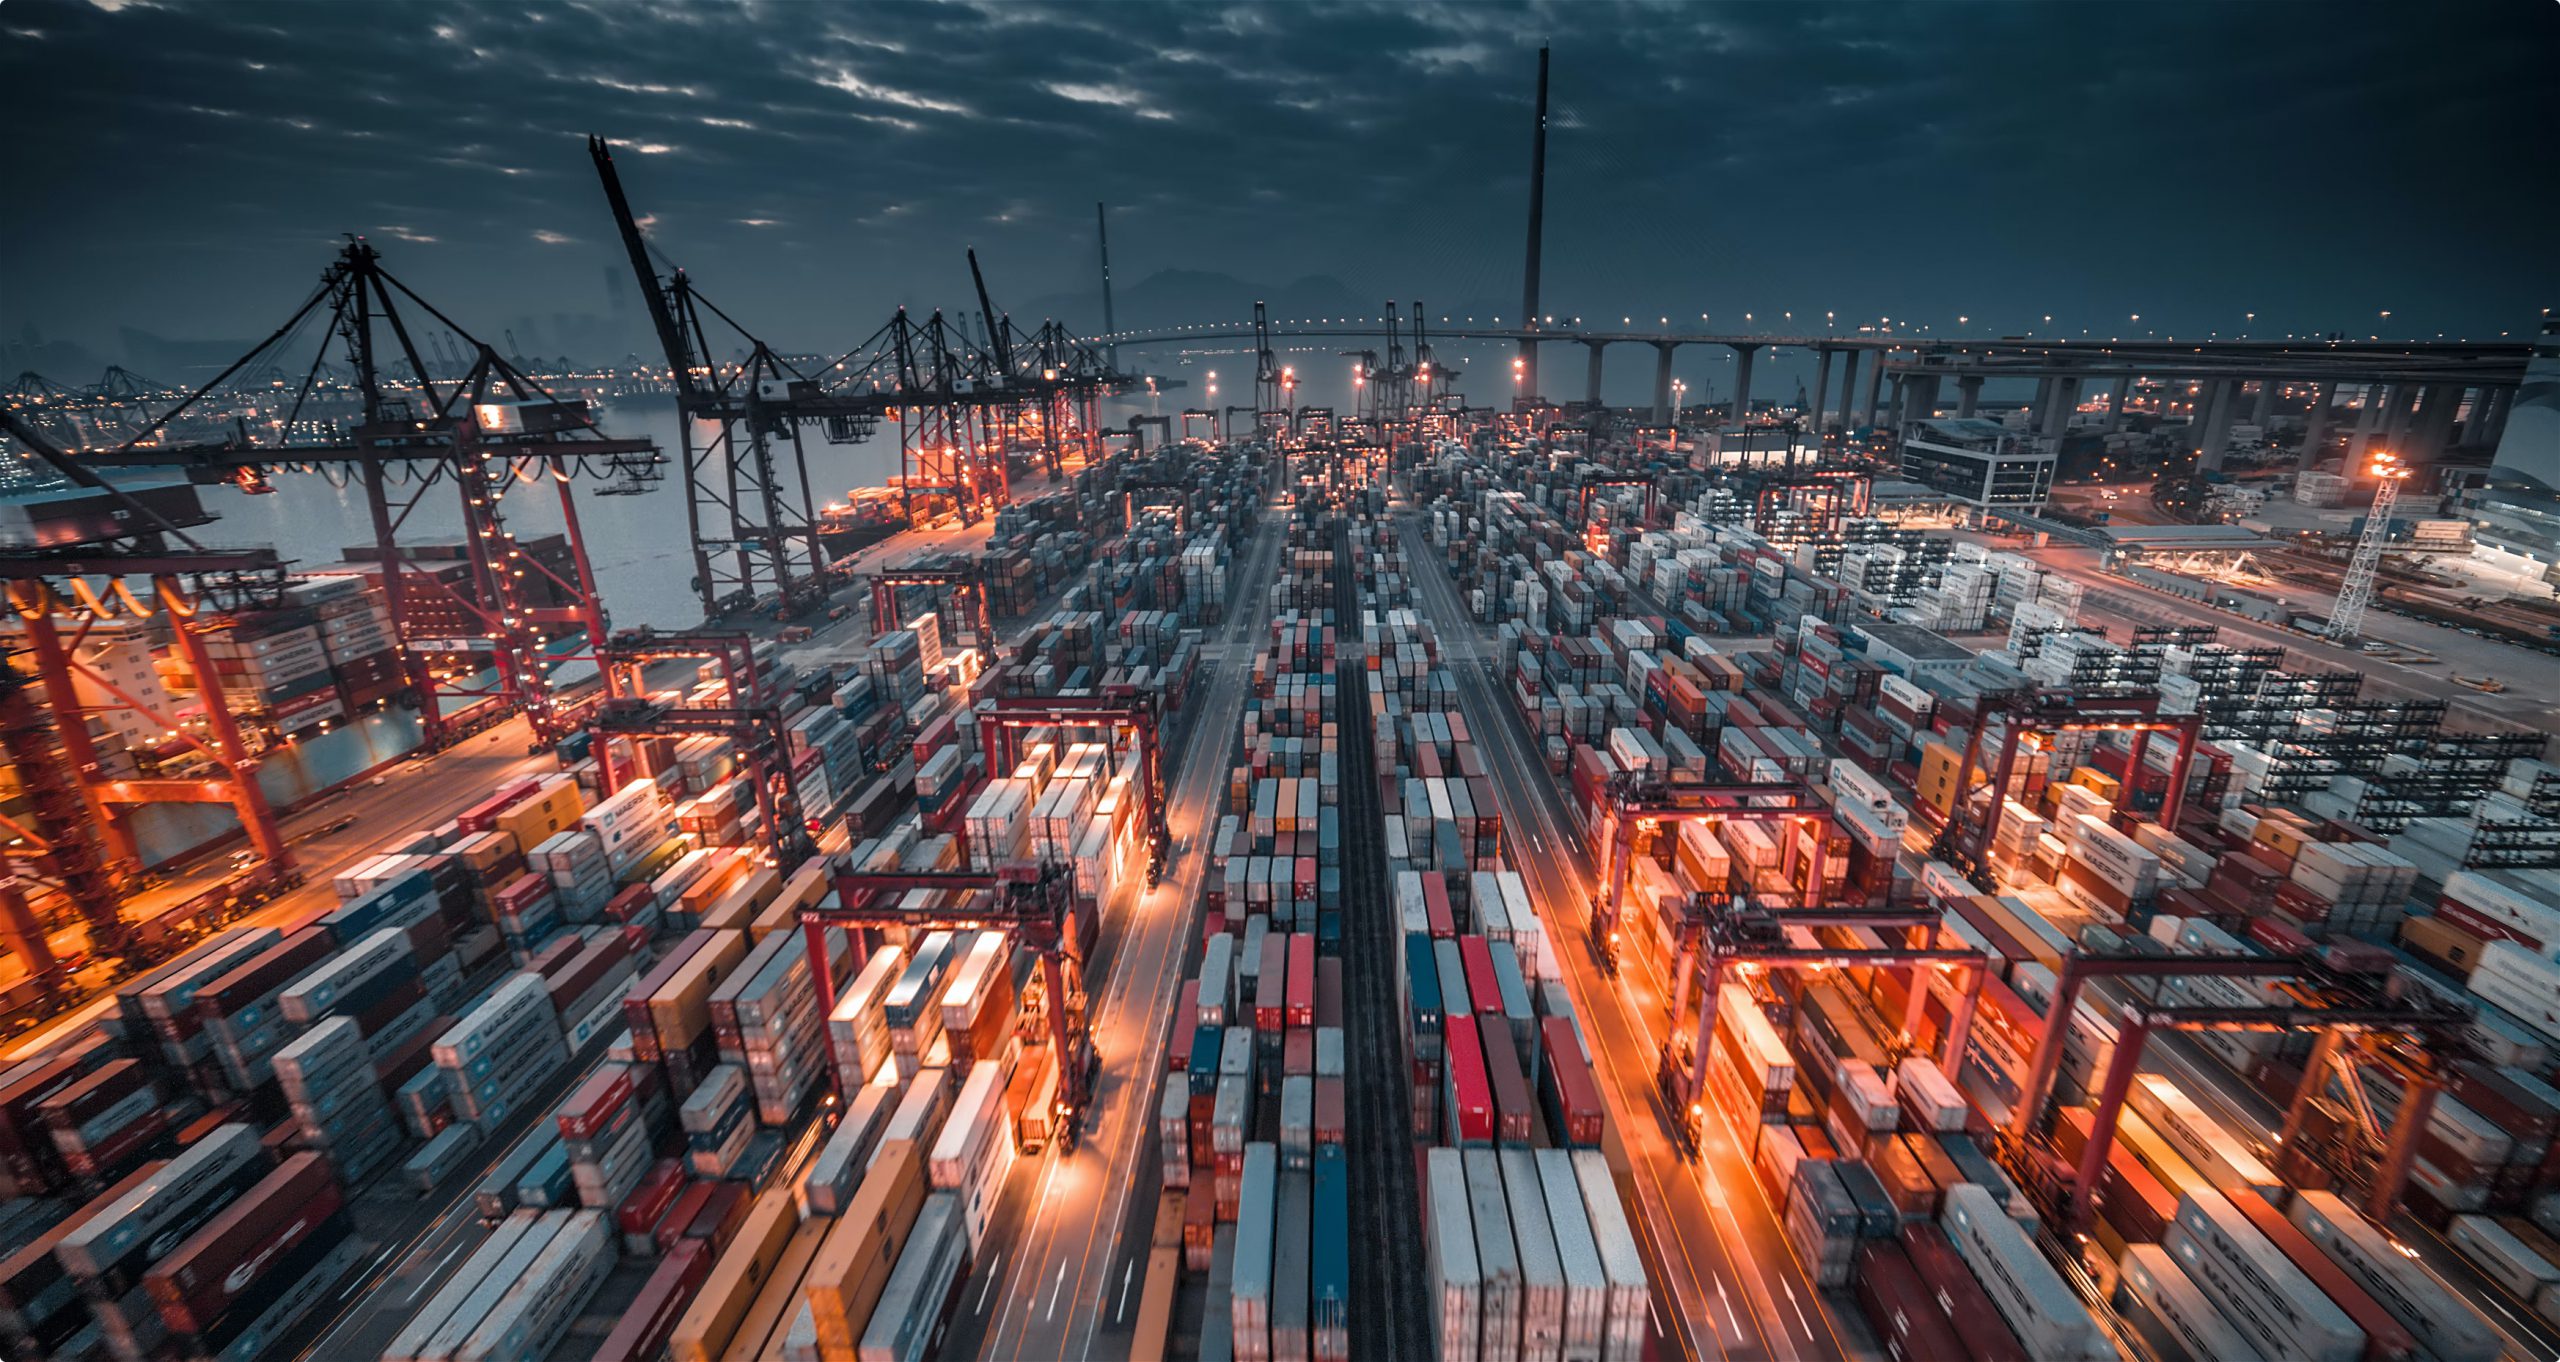
For ocean transport, one important factor is the amount of time spent in port. During this period, the vessel must use smaller, less-efficient auxiliary power generators, or shore power, in order to continue to operate. Larger vessels spend more time in port loading and unloading than smaller vessels, and port operations can also generate substantial CO2. LOG-NET’s Carbon Calculator models the impact of emissions generated during a vessel’s time in port, including the additional time required to service larger vessels.


