There was a lot of discussion of destination capacity to deliver in the pandemic induced tsunami of freight in 2020 and 2021. LOG-NET’s platform analyzes event information in real time to determine the deterministic attributes of things like performance and transit time. This is a sort of real time statistical root cause analysis. During the pandemic the platform began to site to carrier activity that was deterministic to elongated durations. In layman’s terms the carriers actions were a significant cause of the delays during the pandemic.
From a purely computational perspective the platform began to reduce to zero the significance of a carrier provided ETA. The platform favored other network attributes that were more highly correlated to a shipments outcome. The significance of this can not be understated. On August 13, 2021 the computational intelligence of the LOG-NET platform surpassed the cognitive intelligence of the carriers. In no short measure this was due to the.fact that the platform was capable of interpreting the impact of thousands of real time inputs of what is occurring and predicted to occur in the end-to-end supply chain.
“On August 13th, 2021 the computational intelligence of the LOG-NET platform surpassed the cognitive intelligence of the carriers.”
In conditions such as the pandemic even the most tenured of logisticians can be overwhelmed by the number of inputs exceeding the normal state when evaluating the projected activities of a shipment. Whereas in LOG-NET’s machine learning additional inputs are devoured as a means to reduce variability and understand what data is correlated to the objective.
Two such attributes the platform identified as highly determinant were relay port duration and port call count. Relay port duration is a LOG-NET attribute for the time spent by a shipment discharged from one vessel when a shipment is due to load on to another vessel.
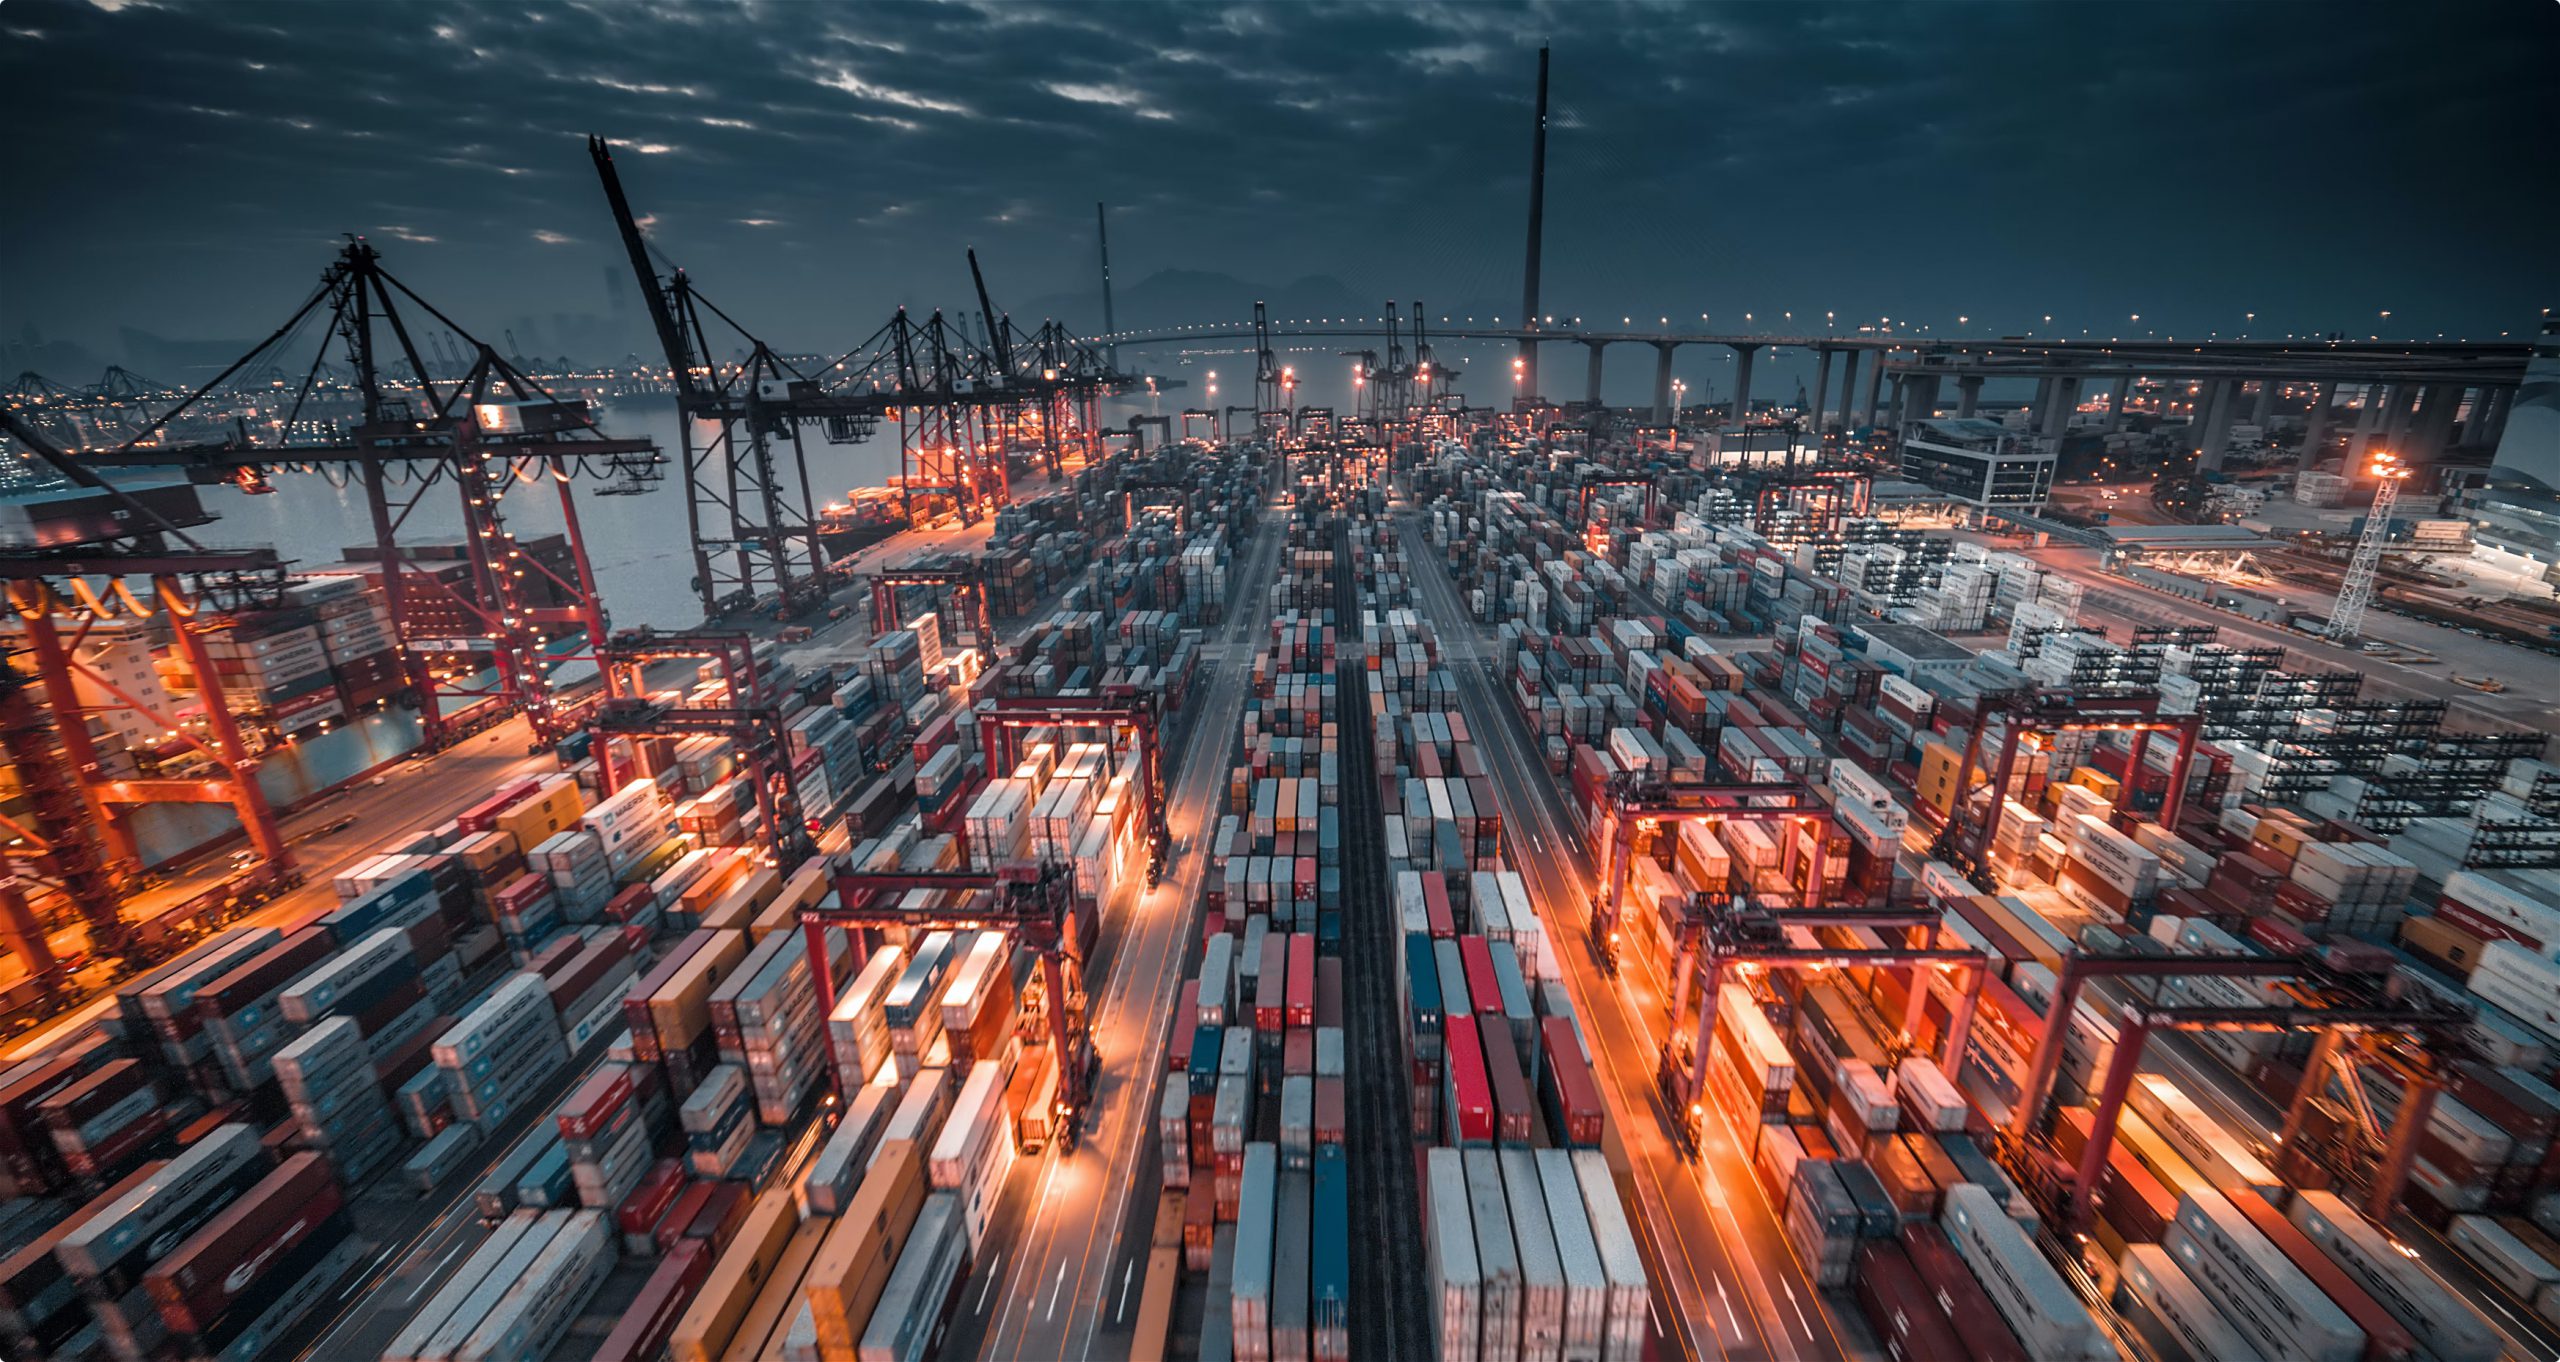
EXAMPLE WEEK OF CARGO MOVING THROUGH SOUTH ASIA
Carrier Created Choke Point
In the instance of relay port duration several carriers send feeder vessels from Southeast Asian countries to line haul vessels via the Straits of Malacca port of Singapore or Tanjung Pelapas. The feeder vessel cargo grossly exceeded the capacity available on the line haul vessels intended to move the cargo to its destination. The image above represents weekly cargo flowing through the South East asian. Represented are four countries with US and European destin freight totaling 800 TEU. Outbound for the same period are vessels totaling 400 TEU of capacity. This would result in 400 TEU of cargo being left behind at the relay port.
Most carriers design their vessel routes to call at least on a weekly basis. During the October to December period of 2021 LOG-NET observed hundreds of containers with delays in Singapore and Tanjung Pelapas of eight to sixteen days. The carrier ETA from the feeder origin would not include the delay which was certain to happen on 44% of this cargo. The LOG-NET platform would evaluate the shipment for the probability of being delayed at the relay port and again at the discharge and any inland movement when considering its ETA. LOG-NET is capable of analyzing the current location of goods and projected location. It can evaluate the containers, vessels, ports, associated facilities and equipment and constantly update alerts and execution plans.
PORT CALL COUNT
For the instance of port call counts the LOG-NET platform detect additional port calls in the route of a shipment. The platform had evaluated the number of port calls as a determinant of transit. As the pandemic progressed the system identified that port calls were being added as relay ports that were not part of the expected route. Cargo, for example, originating in Indonesia destin to the United States port of Savannah would have a port call count of 3.
Origin Port
Relay port in Singapore
Discharge port in Savannah
The system detected an increase in port call counts and began including it in its evaluation of transit. Carriers were increasing the number of times a container was relayed. This same route and carrier was now experiencing additional port calls after Singapore and before Savannah in Port Said or Spain. Adding an additional five to eight days. LOG-NET calls this trend “dumping” containers.
OUR VIEW
The delays encountered by these shipments were significant and causal for a larger percentage of overall transit delay. These shipments would experience further delays at their discharge port in addition to these already accumulated delays. Cargo arriving at port 8-16 days delayed by the carrier and then delayed an additional 10 days at the port has been misinterpreted as restocking items. In actuality the cargo may simply be delayed goods.
It is a stretch to believe carriers did not notice the fact that the cargo they shipped had any chance of being able to transit their networks in any reasonable amount of time when they the goods loaded on feeder vessels. It is worth noting that most carriers have revenue optimizing teams that look to ensure the highest profitability is achieved for a specific sailing. That teams performance and compensation is based on maximizing revenue per sailing. Though the carrier community markets capability to deliver end-to-end supply chains they have institutionalized an optimization goal (their profit) ahead of the customer desire to receive the goods on time.
These misinterpreted delays also cause incorrect reactions in reordering exacerbating the impacts of the bullwhip effect on inventories. Finally some customers who gave up on goods arriving a month late will cancel their orders. That starts a particularly stinging phase for which the bullwhip effect gets its name.